“Data By Doug”
Your CRE Data for Colorado
Colorado CRE activity remains healthy, with industrial leading early 2026 momentum
Colorado’s commercial real estate market entered 2026 with continued transaction activity, although at a more measured pace than the unusually strong start recorded in early 2025. Through February 2026, the market posted 765 total commercial real estate transactions, compared with 834 transactions during the same period last year, representing a year-over-year decline of approximately 8.3%.
Despite this moderation, the broader market remains active by recent standards. Transaction counts in 2025 materially outperformed both 2024 and 2023, and current activity suggests that investors are still deploying capital where fundamentals, pricing, and financing conditions support execution. The market today appears more selective than it was during the strongest parts of the prior cycle, but it is not stalled. Rather, Colorado CRE is reflecting a more disciplined and asset-specific investment environment.
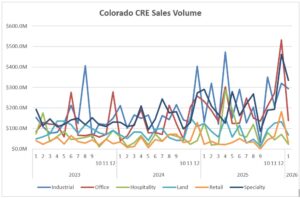
A defining feature of the current market is the divergence between sectors. Industrial has emerged as the strongest early performer, while retail remains the most active sector by total transaction count. Office continues to improve from 2023 lows, though activity remains uneven. Land and multifamily opened the year below prior-year levels, suggesting that development-oriented and rate-sensitive segments continue to face more friction. Specialty assets posted strong relative growth, albeit from a smaller base.
Monthly sales volume remains volatile across nearly every major property type. Larger individual closings continue to influence dollar volume in a meaningful way, making transaction count the more stable and useful indicator of current market momentum.
Statewide Market Performance
Colorado CRE activity improved substantially over the last two years. The market recorded 3,345 total transactions in 2023, increasing to 4,352 in 2024, and then climbing to 5,402 in 2025. Against that backdrop, the first two months of 2026 represent a moderation from a very strong benchmark rather than a meaningful contraction in activity.
The statewide market remains supported by buyer demand in sectors where underwriting is more transparent and leasing fundamentals remain durable. Investors continue to transact where pricing has adjusted appropriately and financing markets allow for reasonable execution. The current environment favors discipline, selectivity, and asset quality over broad-based momentum.
Statewide Transaction Snapshot
• 2023 total transactions: 3,345
• 2024 total transactions: 4,352
• 2025 total transactions: 5,402
• 2026 YTD through February: 765
• Jan–Feb 2025: 834
• Year-over-year change: -8.3%
Link -to summarized report


