Office Space

New Tower in Downtown Denver?

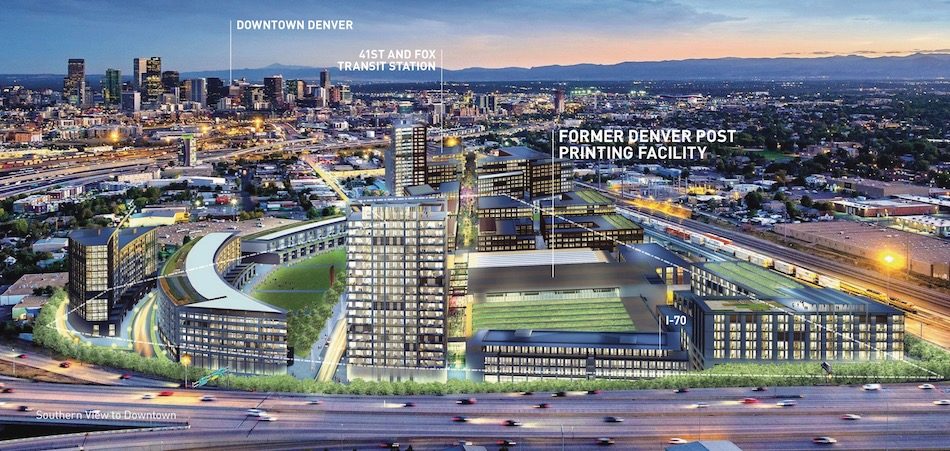
Davis Partnership, a well known local architectural firm, has put together the following video to help explain the 1,000 foot tall tower intended for 1650 17th Street:

Video

Mike Ursini is the developer behind this concept. John Rebchook, with the Colorado Real Estate Journal, has put together some great information with more details in this article:

Colorado Real Estate Journal


Shared Space – A movement in the office sector!
Collaborative office space is making an impact in the world of real estate.  Many Denver companies are choosing to abandon the traditional model of housing employees under one roof and instead are exploring the value of utilizing remote and shared office space.  Some suggest this is a fad and that it may not last.  Others argue that it meets the workforce needs while delivering cost savings to organizations.
Denver Office Rates
While downtown Denver asks for the highest office lease rates, the metropolitan area remains steady with overall lease rate of $26.64.

It stands to reason, that a low unemployment rate has a correlation to higher lease rates.  As of July 2017, the Bureau of Labor Statistics reports the Colorado unemployment rate at 2.4%.  This is well below the national average of 4.6%.

Feel free to contact me directly with questions regarding office lease rates in Colorado.

* Information provided from 3Q 2017 Market Trends©  by Xceligent, Inc All Rights Reserved.
* Direct Weighted Average Asking Rates (FSG)

Amazon HQ2 / Denver area growth

Amazon?

Will Amazon pick Denver as it’s HQ2? I think John Rebchook has the best article with the Colorado Real Estate Journal (click on the picture above to read it) regarding this question. In short, no one truly seems to know if Colorado will be the company’s pick, but one could imagine the synergies between the HQ2 and the new Aurora distribution center.

It is estimated that Amazon’s HQ2 would bring 50,000 jobs. The impact of this is huge! Think about the accommodations of spouses and dependents, the increased demand for housing, retail, transportation, service industries, hospitality, etc.

Denver is catching up!

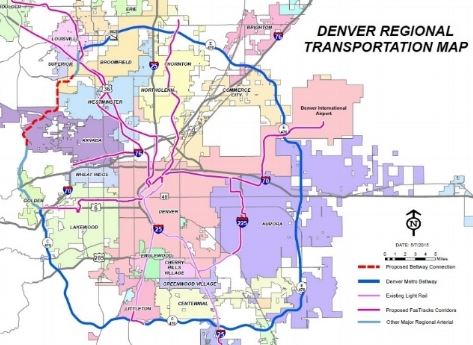
Most major cities have a connecting loop around the central business area. In fact, there are two primary development concepts that support this type of growth, central and axial. The reason for this looped concept is to allow for easier access throughout the area without the major traffic build up found exclusively in a grid design.

Will this be a toll road? When E-470 (the opposite side of this loop) opened in 1991 it was built as a toll road. However, this section of the highway has not clearly stated if any of the segments will be based on a toll structure.

Whats the big deal ?

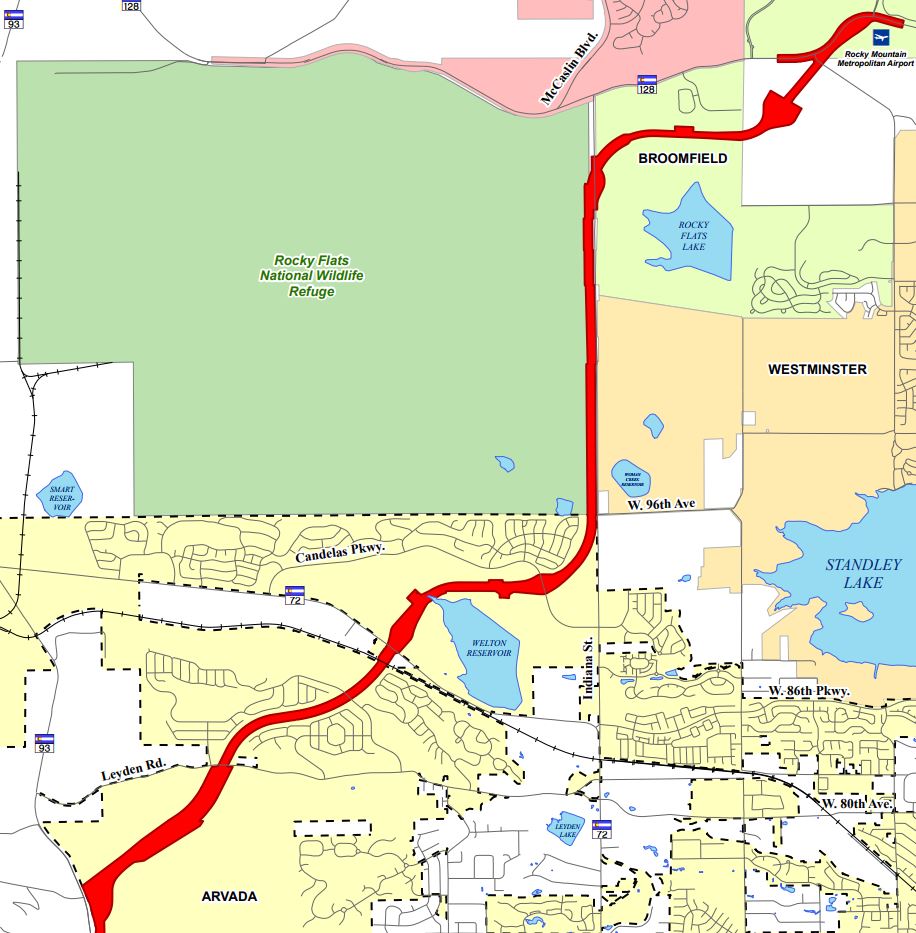
Since the inception of this road, residential and commercial developers have flocked to this area with the anticipation of continued growth. For example, the King Soopers at the intersection of 90th & Indiana has already broken ground and is expected to be complete by the end of the year. (Located at the bend in the middle of the map). This is the first retail development in this area and others are sure to follow.

The completion of the Jeffco Loop runs right thru the nationally ranked zip code of 80007. This is mutually enticing to the developers and residence, who have an average household income of $158,469.

Down Town Westminster

Doug’s Commercial Report (Denver)

The old Westminster Mall is going to be the new Downtown Westminster!

Now that the old mall has been torn down, it will be fun to watch the new development take place. In short, here are some of the anticipated highlights:

  • 4,500 new residences
  • 700,000 SFT of retail space
  • 2,300 new residential units
  • 8,000 new workers

If you were curious, the original mall opened in 1977, and at it’s peak it had a total of 1,200,000 SFT. It was demoed in 2012 through eminent domain, but suffered many big box sore closures before that between 1997 through 2009.

Down Town Westminster

It’s hard to believe this site was primarily one building when you look at the new site plan. However, many people are excited to see the activity in the area. This should bring the city of Westminster a lot of activity in a multitude of ways. I say a multitude of ways because it’s not just a sales tax basis that this site will bring as much of the plans has ties to mass transit through RTD. The parking garage, and current RTD bus stop across from the site already get a lot of attention as it seems to be the gateway between Denver / Boulder. This will now add to that activity, and attract even more attention.

Parking / RTD

One of the comparisons I keep hearing for this site is that it should end up looking something like Belmar in Lakewood (Belmar replaced the old Vila Italia mall by converting it to a mixed use site). However, the parking at this location is distinctly different due to the proximity of the RTD stops and it’s position just off of highway 36 / Boulder turnpike.

The city has recognized this aspect, and I am betting that is why the first building that has been complete is the new parking garage. They put together this quick video to further explain:

New Parking Garage Video

Disclaimer: All information provided is based on data from the county of Denver records and is not intended for investment advice. The quantity count in this report is based on  the count of parcel s reported within each transactions. Call for details , and or, inquiries on the data provided.Our mailing address is:

1019 8th St
Golden, CO 8001
303-277-1322
www.CommercialDoug.com

Denver Commercial Report – July

Doug Jennings, CCIM | 720-434-6637 | [email protected]

View this email in your browser

Doug’s Commercial Report (Denver)

Office Impact

Yesterday, and today, the conversation seems to be around the topic of collaborative space when it comes to office talk. In the past we seemed to have focus on ergonomics, and maybe even basic efficiency in how our office spaces operates. You may even remember seeing the inflatable workout ball as a chair. However, tomorrows conversation for office space is all surrounded with the topic of self-driving cars. I herd a quote the other day that said as much as 40% of the down town Denver market space is currently used for parking. Whether this is from off street space, or parking garages, this is a significant number that will have a major change once the autonomous vehicle becomes a standard in the market place.

This change isn’t just impacting office space, but it is going to be just as big of a game changer as the internet has been. In fact, here is a story of a beer truck in COLORADO that successfully delivered a load through  self driving technology:

Self Driving Beer Truck

Office, Office, Office….

From building amenities, to the list of some of the most recent – top of the line offices, I think this article best captures the total landscape of Denver’s office space:

CREJ Office Quarterly Review

Better yet, if you want some great details of some of the top office space in the area, don’t miss this breakout:

CREJ Office Roundup

Total Sales – Office Space

I like to look at the historical sales in a minimum of a three year view. I think that if you only look at one year at a time it is easy to get lost in the seasonality of any cycle, and it’s easier to see in this chart that the beginning / end of the year could easily move someones view if we were presented the data in anything less than a longer term perspective. That said, I don’t see anything out of line with the office space for the Denver market place. The only thing that I would add to this view of the market place is new office buildings that are to come online as we have all seen the new buildings in the down town area. I will try and find a way to add this data in the future. Or, if you have a specific request in how to review any of this, feel free to let me know?

Disclaimer: All information provided is based on data from the county of Denver records and is not intended for investment advice. The quantity count in this report is based on  the count of parcel s reported within each transactions. Call for details , and or, inquiries on the data provided.

Our mailing address is:

1019 8th St
Golden, CO 8001
303-277-1322

Denver Commercial Report – June 2017

Land Sales
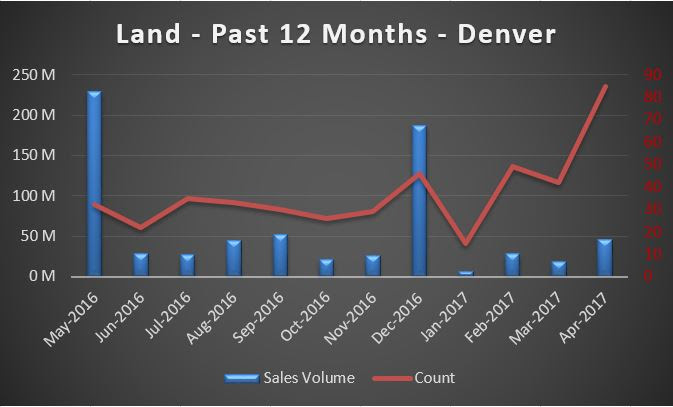
While April produced $46M in total sales of dirt in Denver, the two months that stand out are still December and May. When I look at the last twelve months of transactions I know that there is some seasonal activity that happens around January and December of each year, so my eyes go directly to the May of last year. The reason this stands out is prominently from the sale of 1919 19th St which sold for $154M.

Proof of growth?
It’s been said that you can tell what cycle any city is in by looking to the skyline and counting the number of cranes. So, as I look over Denver I cant help but notice we have allot of skyline activity, and I enjoyed this article by John Rebchook:

The Crane Is The New State Bird

Who knew there was a real index to measure the number of cranes?

Total Sales
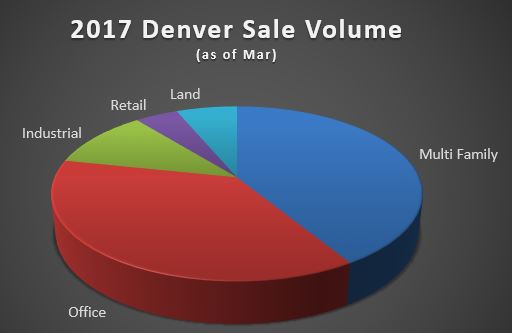
Apartments still lead the way in the Denver market when it comes commercial sales as 53% of all transaction are in MUH (YTD). However, land sales make up 14% of the total sales for the year and I think this can be a good indication of how the market will favor due to the amount of land that will be used to make more housing. There is still a shortage of supply in the Denver area for housing, and none of the indicators are screaming that this will change soon.

Denver Commercial Report – March 2017

Overview
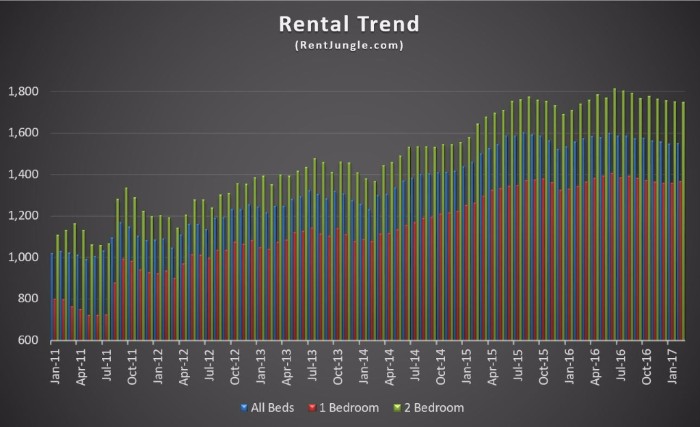
There is no question that the rent rates for apartments has grown in Denver over the years. The real question is what is going to take place going forward?

While the Denver Post put this article out in June, I think it is still a great reflection on what is taking place for apartments in the Denver area:

Denver Metro Rent

Also, I always enjoy the work that DU associate professor of real estate Ron Throupe puts together. As a former student of his I know first hand as to how much work goes into his studies & the Universities research.

Multi Family
Over the year I expect to see more industrial transactions, along with land sales. However, for the first quarter of this year we can see apartments holding steady to the percentages we have seen in the last few years.

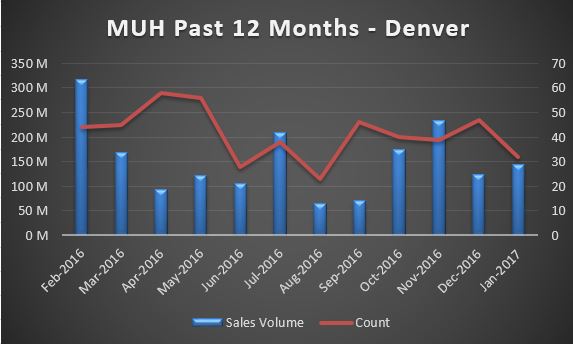
March has proven to be the banner month for both the number of transactions and in terms of total dollars for apartments. However, the highest single transaction for the year still holds to be in January with the Capital Hill Apartments transaction of $19.5M.

Historical Volume

Is Denver in a boom, or a bust cycle? From my opinion – I think we have a solid year of growth ahead of us. The entry level housing units still do not exist in the market place for Denver, and the population growth is still strong for Colorado. As long as the employment for the area holds strong I think the indicators all point to a strong upward direction for commercial space.

Denver Commercial Report – February 2017

The “Shadow” Market

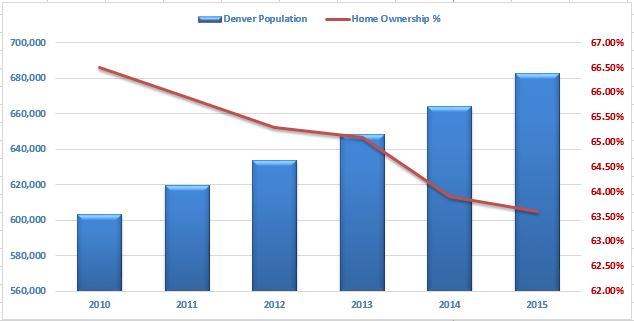
While the Denver area population continues to grow, the home ownership rate continues to shrink. This, along with things like the construction defect laws, is causing what I am calling the “shadow” market on the Denver area as we see more and more apartment buildings with less new condos and homes.

While some estimates put the growth for Colorado to be around 100k in total population for 2017, it is easy to see that there is a gap in housing with a total of 61k residential transactions for 2016 in the metro area. I think this is an easy trend to anticipate to continue throughout the year.

Breakout of Property Type

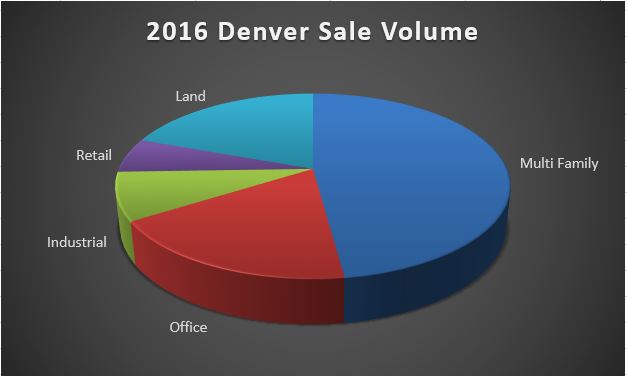
With the multi family sales totaling 48% of the commercial landscape in Denver county for last year, it’s easy to see how the topic of apartments make up a major part of our expectations for 2017.

Another interesting thing to point out is that we are seeing renters spend more as a total percentage of their income for rent. The Denver Post had a good article on this:

Denver Renters

Apartments / MUH

I like to look at the history with both a view on the dollar volume and the number of transactions. This type of a view on the data allows us to quickly see short term trends and measure if our current period is a peak or valley. Let me know if you have any requests in how to look at the data, and I’m happy to play with the information to assist.

Doug’s Commercial Investment Report – January 2017

Overview
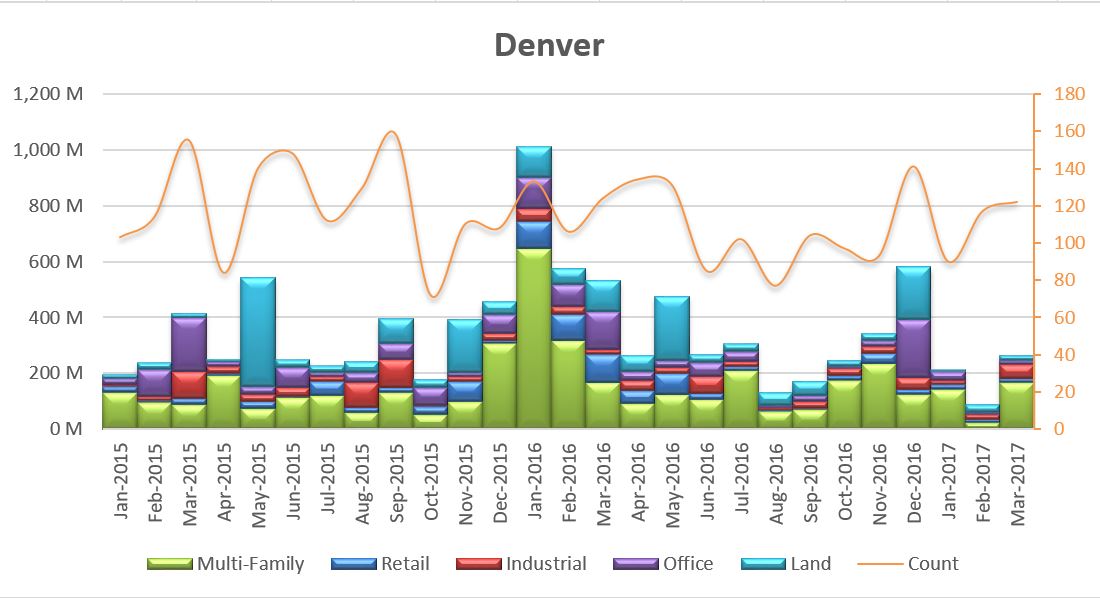
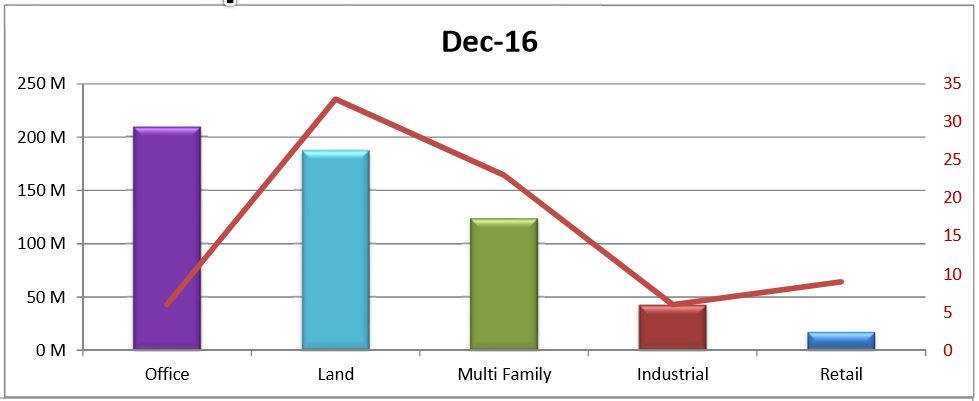
While office space lead the way for December, multi family properties accounted for just over 47% of all the gross transactions (sales) in Denver county for the year. December, also showed favorable for land transactions. The month of May was the only other month of the year that had greater volume of land transactions than December.

Both the volume and transaction count lead the pack for multi family transactions and land. In fact, in terms of the number of total transactions across all property times, multi family and land transactions accounted for just over 69% of all sales transactions in Denver county.

Multi Family
No doubt, multi family leads the way in Denver commercial real estate for 2016. There were 524 transactions, and $2.3 billion it total volume for the year. This accounts for 47% of the total commercial volume, and 39% of the transaction count for 2016.

There is allot of conversation as to why this is, and I boil it down to three primary things: 1. Population Growth 2. Employment 3. Construction Defects I will dive more into this analysis in next months news letter, but the quick explanation is that as we grow in population and employment we need more homes which have been limited.


Office
Office transaction accounted for just under $739 million in 2016 which is 11% of the total commercial volume for the year. There were 130 transactions which makes the transaction count 10% of the total transactions for the year. December was the record month for the past two years. This is primarily due to a transaction that took place with one specific property that sold near the Convention Center for just over $154 million. That makes this single transaction 3% of the total commercial space for the year (in terms of sales value), and 21% of the office segment for the year.


Industrial
The total count for 2016 industrial transaction was 151 with a sales volume of just over $352 million. This makes the industrial space only 7% of the total commercial transaction volume, and 11% of the total count for the year.
The big news for Denver industrial space is that Amazon has announced it will be opening a 1 million square foot fulfillment center in the area -this will have an impact to the industrial space for 2017.


Retail
In Denver county, retail transactions accounted for 11% of the over all commercial volume of just under $816 million. County records show a total of 127 transactions which makes it only only 10% of the total number of transaction that took place in 2016.


Land
There were a total count of 395 transactions categorized for land within Denver county for 2016, and a total of just under $958 million in volume. This accounts for 19% of the total commercial volume for the year, and 30% of total transaction count. While it may look like the record month for land volume was in December, May actually beet the volume by just under $41 million.

Historical Volume
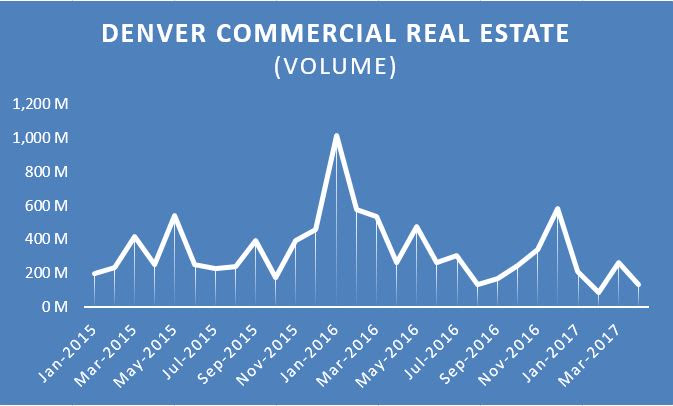
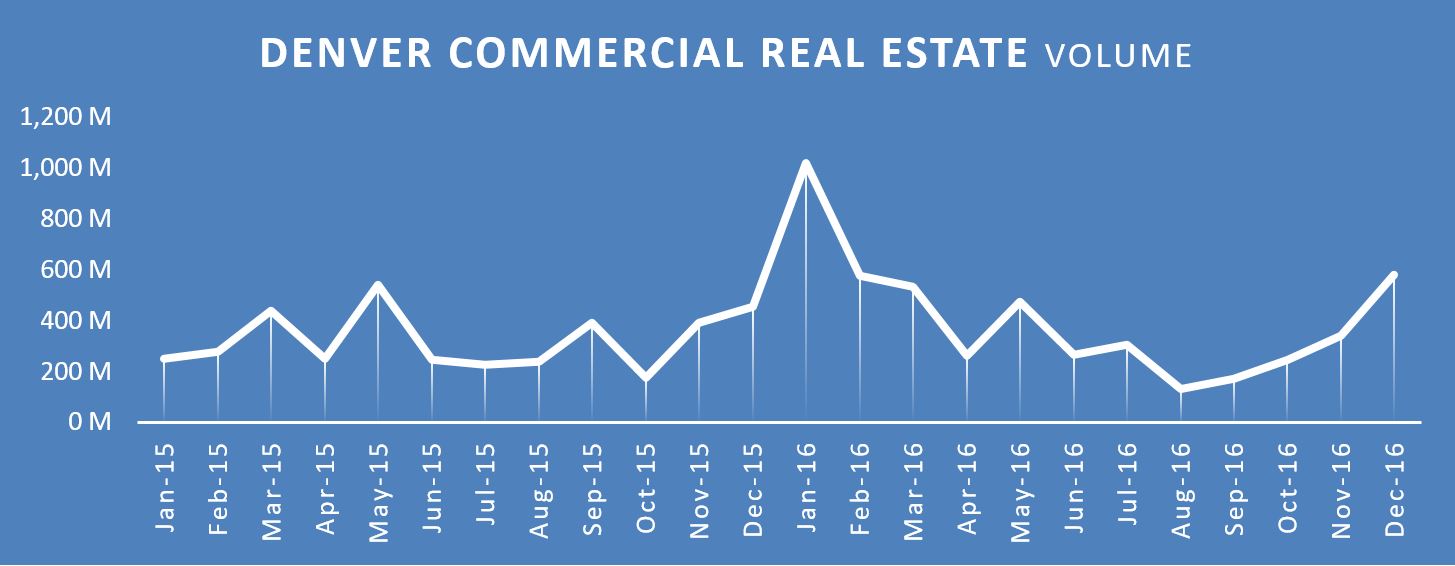
When we look at the the past two years, January 2016 stands out as a record month in terms of total sales volume. This is due primarily to four significant multi family transactions that account for just over $543M. To put this in prospective, these four transactions account for 11% of the total commercial volume in Denver county for 2016, and it makes up 23% of the annual total for multi family segment.

All four of these transactions had key locations as they are located near DIA, Coors Field, Saint Joseph’s Hospital, and the Denver Tech Center.